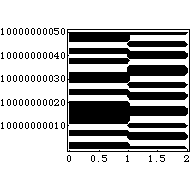
Problem of the Week 988A Graph That Will Make You SmileAlice: I have just come across a graph that is the funniest thing I have ever seen. Just graph the set of points (x,y) such that 1/2 < floor[ mod(floor[y/17] 2^(-17 floor[x] - mod(floor[y],17)), 2) ] Bob: Let me be sure I understand: the thing inside the outermost "mod" is not an integer. What does "mod" mean here? Alice: It means the remainder when multiples of 2 are subtracted. So mod(15/4, 2) would be 7/4. The mod function in most computer programs works this way, so don't worry about it. Bob (some minutes later). You're right. It is not hard to graph. The function on the right is either 0 or 1 so it is just a matter of computing where it is 1. I did it and didn't see any points at all for small values, so I went up a bit and found the following. I fail to get the joke.
Alice: Oh, I forgot to say: You have to graph this for x between 0 and 110 and y between k and k+17, where k is the following 543-digit integer. 96093937991895888497167296212785275471500433966012930665150551927170 28023952664246896428421743507181212671537827706233559932372808741443 07891325963941337723487857735749823926629715517173716995165232890538 22161240323885586618401323558513604882869333790249145422928866708109 61844960917051834540678277315517054053816273809676025656250169814820 83418783163849115590225610003652351370343874461848378737238198224849 86346503315941005497470059313833922649724946175154572836670236974546 1014655997933798537483143786841806593422227898388722980000748404719 Bob (after a break for some more computation): Oh, now I get it! Very funny indeed. What was the joke? © Copyright 2003 Stan Wagon. Reproduced with permission. |
